Sponsored Content by HORIBAReviewed by Olivia FrostAug 15 2025
Although the fluorescence timescale is suitable for monitoring numerous biological processes, certain processes often require monitoring over extended durations. To access intrinsic amino acids, such as tryptophan, as probes, the UV excitation wavelengths for pulsed phosphorescence measurements have long been the preserve of low-repetition-rate gas-filled lamps or larger laser systems.
Recent advancements have enabled the use of interchangeable semiconductor diodes, known for their simplicity. SpectraLEDs (Figure 1), which offer spectral coverage from the UV to the near-IR, are ideal for such measurements and have been previously applied in studies of lanthanides and singlet oxygen (refer to Application Notes TRFA‐4, ‐6, ‐11, and ‐12). Unlike xenon flashlamps, these sources do not exhibit a “tail” and can run at elevated repetition rates (several kHz).

Figure 1. Selection of SpectraLED pulsed excitation sources. Image Credit: HORIBA
These sources can attach directly to DeltaHub or FluoroHub timing electronics, with repetition rate automatically adjusting to the selected time range via the DataStation measurement software. This software also manages the duty cycle and temporal position of their output as needed to align with sample settings.
Experiment
Measurements were conducted utilizing the DeltaFlex system, equipped with either a SpectraLED S‐295 or DeltaDiode DD‐295 excitation source for phosphorescence (44 ms range) and fluorescence lifetime (100 ns range) measurements, respectively. Data was analyzed using DAS6 as the sum of exponentials, presenting either the relative amplitudes (or fractionals, fi) or normalized pre‐exponentials (αi). The main governing equations are listed below:
Sum of exponentials
The contribution of each emitting species can be represented as either a normalized pre‐exponential (α) or relative amplitude (or fractional, f).
Here, the average lifetime can be represented:
τave = Σαiτi
Treated data was plotted utilizing FluorEssence software based on Origin. Despite singlet-state excitation, the phosphorescence emission appeared at extended wavelengths compared to the fluorescence emission. Potassium iodide and sodium sulfite were added to the HSA solution as deoxygenators to observe RT phosphorescence from tryptophan.
HSA fluorescence with increasing temperature
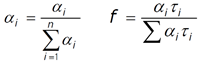
Research has demonstrated that HSA experiences multiple reversible structural changes before irreversibly denaturing above ~75 °C. To determine whether the time‐resolved tryptophan decay was affected by this, a temperature study was conducted, tracking its fluorescence. As anticipated, the decay required the sum of three exponentials to fit the data. Results are presented in Figure 2.
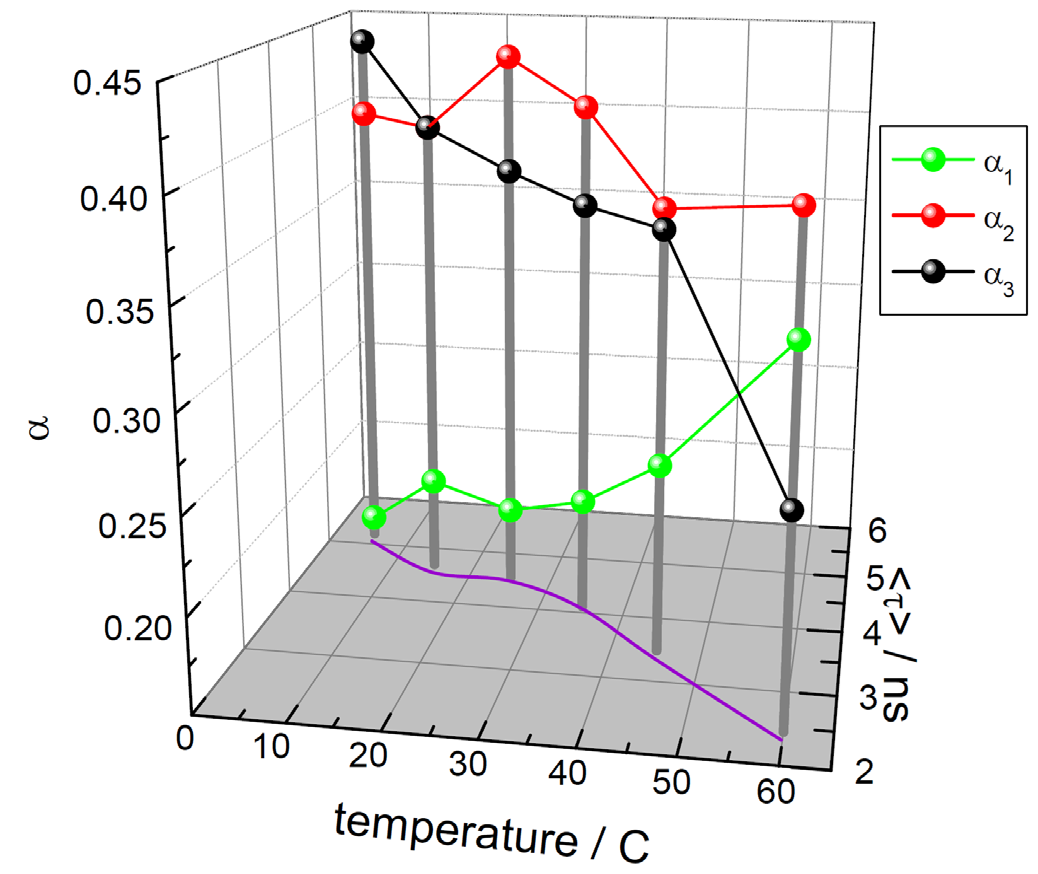
Figure 2. Effect of temperature on the time‐resolved decay of tryptophan in HSA, with exponential analysis showing normalized pre‐exponentials (αi, 1 relates to shortest‐lived, 3 to longest) and average lifetime, <τ>. Image Credit: HORIBA
This analysis method reveals a clear change in fluorescence as temperature increases. Overall lifetime decreases, along with a change in the contribution of individual lifetimes to the emission. In practice, selecting an ideal analysis model depends on the system under study and the process to be monitored.
Time-resolved phosphorescence
The phosphorescence emission wavelength is red-shifted relative to the fluorescence. Here, the phosphorescence decays, collected at 450 nm, were measured across a similar temperature range, with outcomes illustrated in Figure 3.
Figure 3. Time‐resolved phosphorescence data, showing the fractional contributions (fi, 1 shortest‐lived, 3 longest‐lived) and the average lifetime. Image Credit: HORIBA
These findings provide evidence for the existence of multiple emitting species, with average lifetime and relative contribution varying with temperature. The average lifetime trend reflects other studies showing transitions related to thermally-induced conformational changes.
Conclusions
The measurements presented in this article validate the DeltaFlex’s capability, equipped with multiple excitation sources, to track both fluorescence and phosphorescence of tryptophan in human serum albumin.
The impact of temperature on tryptophan decay kinetics is evident in the analysis and is most noticeable in the phosphorescence dataset. This highlights the potential of this measurement method for studying this protein. The measurements presented in this study are based on those by K. Sagoo et al. Spectrochim. Acta A, 124 (2014) 611–617.
About HORIBA
Founded in 1953, HORIBA has explored a wide range of unique measurement and analysis technologies to meet global customer needs from 47 group companies and local sites spread across 28 countries and regions. Under the corporate motto Joy and Fun, the company has expanded and refined its core tech-nologies to solve society’s energy issues of today and tomorrow. Our unique measurement and analysis technologies are valued in various fields of society including the three megatrend business fields of Ener-gy & Environment, Biology & Healthcare and Materials & Semiconductor. For more information on HORIBA, visit https://www.horiba.com/int/company/about-horiba/home/

Sponsored Content Policy: News-Medical.net publishes articles and related content that may be derived from sources where we have existing commercial relationships, provided such content adds value to the core editorial ethos of News-Medical.Net which is to educate and inform site visitors interested in medical research, science, medical devices and treatments.